

Changes in Top Pages: While other key pages have decreased slightly in views this month, the Supplier page has increased from 2,638 views to 3,381 views, possibly due to Tariffs and other legislative initiatives.
Social Traffic Increases: Traffic from LinkedIn nearly double from March to April, and Facebook traffic has significantly increased. This may be the cause of an increase in mobile users in April.
Project/Market Performance: Pluto Train 2, Port Arthur LNG, and Rio Grand LNG are the top performing projects, and Energy, Infrastructure, and Nuclear Power are the top performing markets.
/careers
64,717
Views
27,922
2.32
Sessions
51s
Time on Site
303,027
Events
/ (Homepage)
41,579
Views
22,394
Active Users
1.86
Sessions
31s
Time on Site
180,350
Events
/Contact
6,241
Views
4,438
Active Users
1.41
Sessions
1m 15s
Time on Site
25,405
Events
/Search
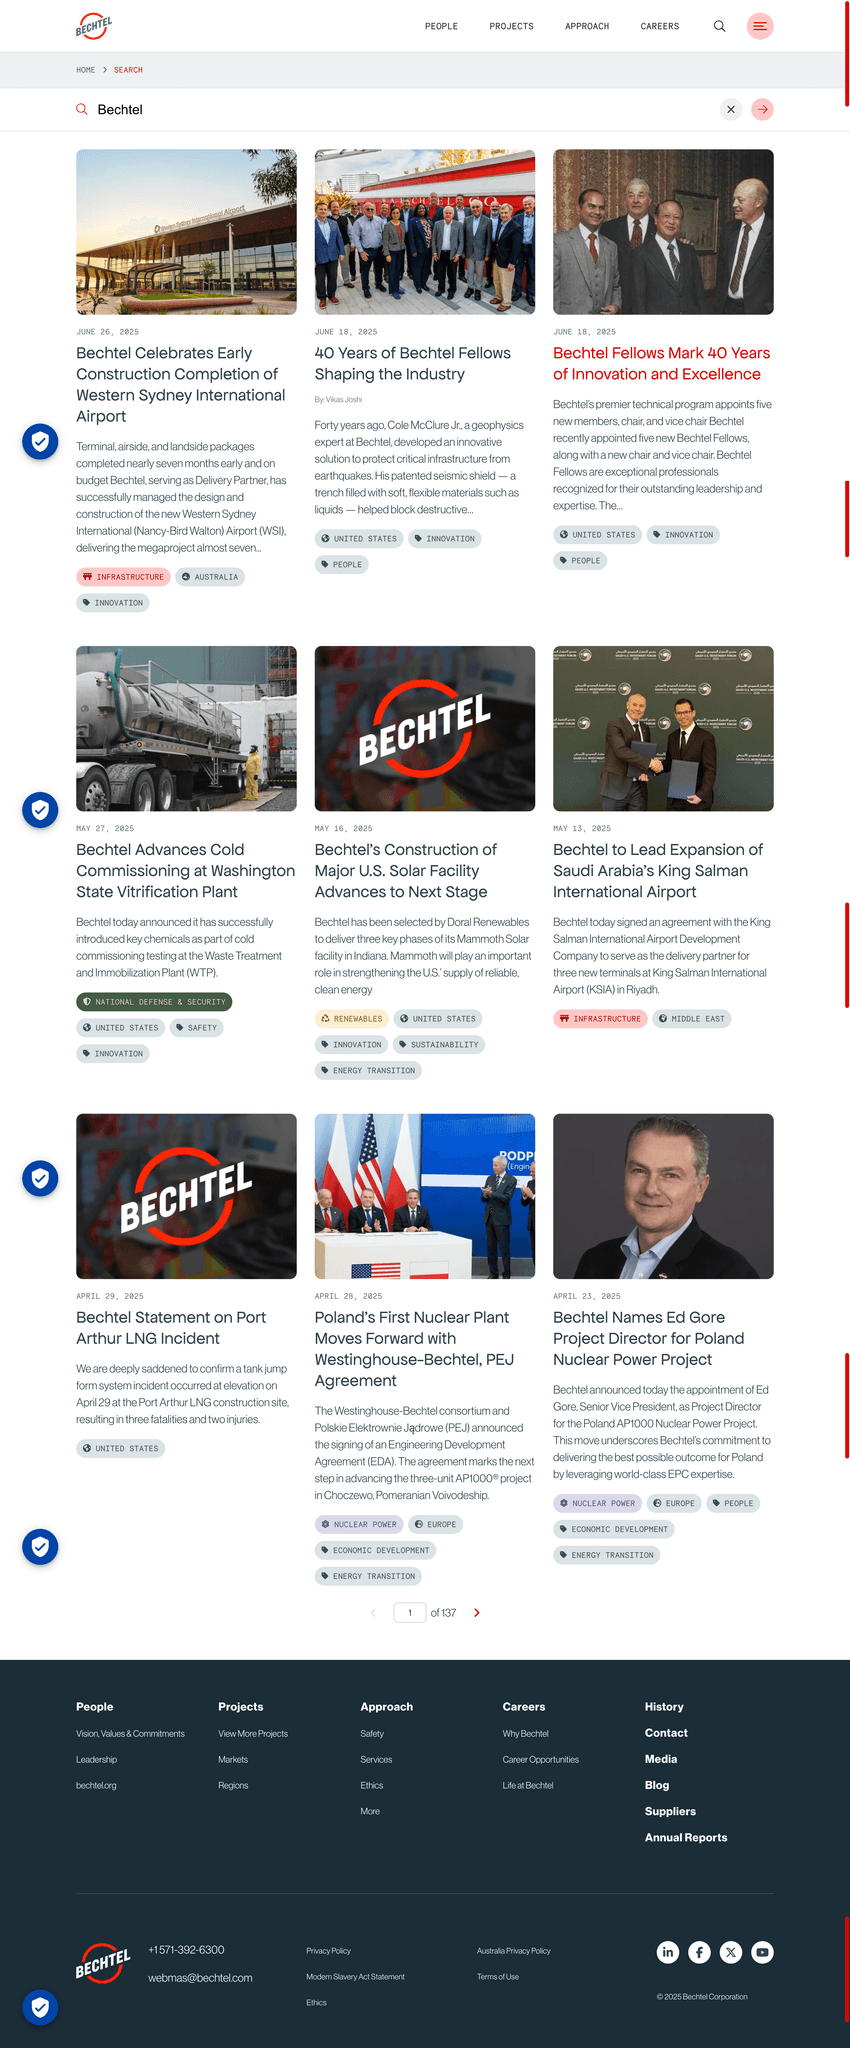
4,702
Views
3,428
Active Users
1.37
Sessions
43s
Time on Site
20,625
Events
/Supplier
3,381
Views
3,428
Active Users
2.09
Sessions
47s
Time on Site
19,681
Events